Run Custom Availability Tests using PowerShell and Azure Application Insights, even on-premises

Application Insights (part of Azure Monitor) is an Application Performance Management (APM) service. You can monitor your applications on Azure, on-premises, and anywhere else to get key insights into the performance and usage of your applications. One feature of Application Insights (AI) which is often overlooked but key to many applications is Availability tests.
Application Insights Availability Tests #
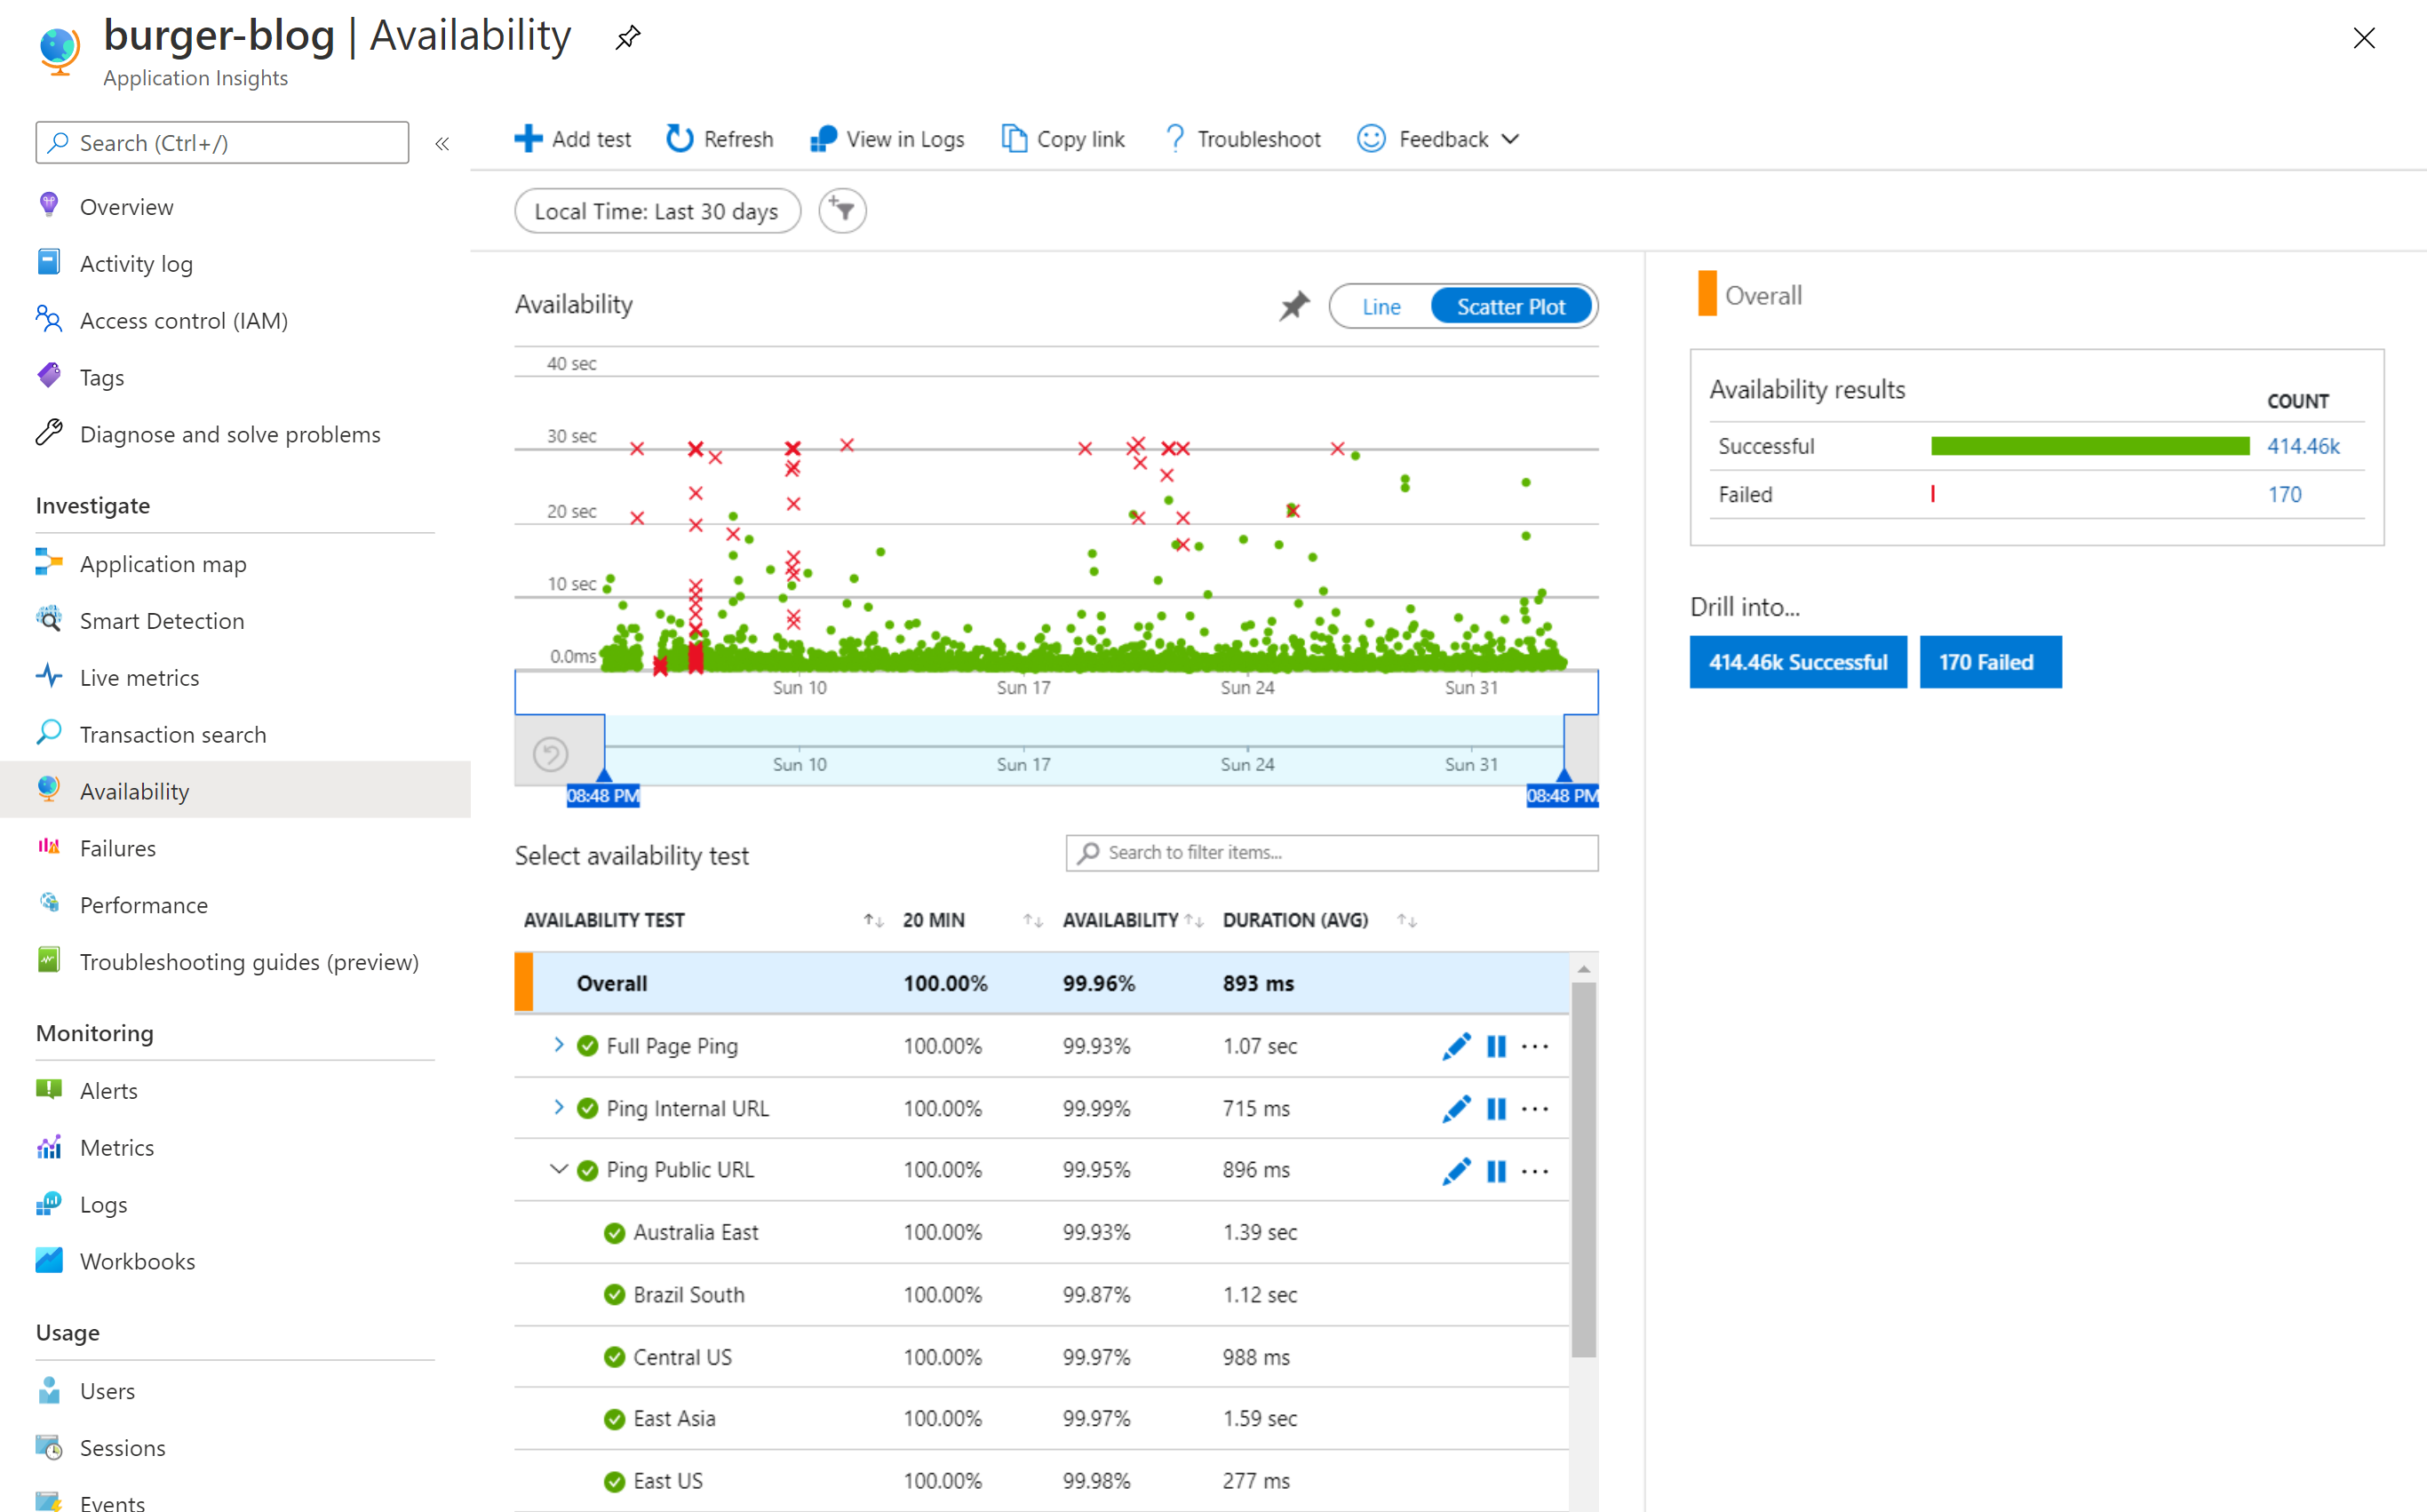
The Availability features within Application Insights allow you to create tests to verify the availability of your applications. Here's a screenshot of the Availability blade in the Azure Portal:

The 3 tests in the screenshot are configured to test the availability of my application in different ways and the results are plotted in the graph above.
You can configure simple URL tests that will send HTTP requests to the specified URL and verify the HTTP response. You can also configure multi-step web tests for more complicated scenarios which you can build using Visual Studio Enterprise.
Both types of availability tests can be configured to run at a frequency of your choice. But one of the coolest features in my opinion is that you can configure these tests to run from 16 different locations. This way you not only verify the availability of your application from one location, but you can verify the availability from all over the world and compare the performance between locations. Once the tests are configured, you can set up Azure Monitor Alerts to notify you using SMS, phone, emails, and push notifications.
The built-in Availability features of Application Insights are great, but
- what if you don't have Visual Studio Enterprise, or don't want to use this proprietary testing software?
- what if your application is hosted on-premises or inside a locked-down VNET? The built-in tests can only test publicly available applications
- what if you already have scripts to verify availability, but still want to integrate with Application Insights for its data storing, querying, dashboards, and alerting capabilities?
In that case, you can develop your own custom availability tests and send the data to Azure using the Application Insights SDK or send it to the Azure API directly.
Create a Custom Availability Test using PowerShell #
The easiest way to send availability data to Application Insights is to use the Application Insights SDK. For PowerShell, you can use the .NET version of the SDK since PowerShell can natively interop with .NET. Follow the steps below to create a custom availability test using PowerShell.
Open a PowerShell shell and create a folder to store all your files:
mkdir PowerShellAiAvailability
cd PowerShellAiAvailability
If on Windows, use the NuGet CLI (download page) to install the Application Insights SDK NuGet package:
nuget install Microsoft.ApplicationInsights -Version 2.16.0 -o Dependencies
This command will create the 'Dependencies' folder, and then download and unpack the required packages to the folder.
There are other ways to install NuGet packages, but you can always fall back to downloading the package manually from the NuGet gallery. To download the package, navigate to the NuGet package page and click on the link "Download package". The extension of the file will be "nupkg", but this is a simple zip-archive. Rename the extension to "zip" and unzip the archive. The DLL's can be found in the 'lib' subfolder.
Now that you have the AI SDK DLL's, create a PowerShell file 'CheckAvailability.ps1' with the following contents:
$MyInvocation.MyCommand.Path | Split-Path | Push-Location;

# Update the path if you install a different version of AI NuGet package
Add-Type -Path .\Dependencies\Microsoft.ApplicationInsights.2.16.0\lib\netstandard2.0\Microsoft.ApplicationInsights.dll;

$InstrumentationKey = $Env:APPINSIGHTS_INSTRUMENTATIONKEY;
# If your resource is in a region like Azure Government or Azure China, change the endpoint address accordingly.
# Visit https://docs.microsoft.com/azure/azure-monitor/app/custom-endpoints#regions-that-require-endpoint-modification
$EndpointAddress = "https://dc.services.visualstudio.com/v2/track";

$Channel = [Microsoft.ApplicationInsights.Channel.InMemoryChannel]::new();
$Channel.EndpointAddress = $EndpointAddress;
$TelemetryConfiguration = [Microsoft.ApplicationInsights.Extensibility.TelemetryConfiguration]::new(
    $InstrumentationKey,
    $Channel
);
$TelemetryClient = [Microsoft.ApplicationInsights.TelemetryClient]::new($TelemetryConfiguration);

$TestName = "AvailabilityTestFunction";
$TestLocation = $Env:COMPUTERNAME; # you can use any string for this
$OperationId = (New-Guid).ToString("N");

$Availability = [Microsoft.ApplicationInsights.DataContracts.AvailabilityTelemetry]::new();
$Availability.Id = $OperationId;
$Availability.Name = $TestName;
$Availability.RunLocation = $TestLocation;
$Availability.Success = $False;

$Stopwatch =  [System.Diagnostics.Stopwatch]::New()
$Stopwatch.Start();

$OriginalErrorActionPreference = $ErrorActionPreference;
Try
{
    $ErrorActionPreference = "Stop";
    # Run test
    $Response = Invoke-WebRequest -Uri "https://swimburger.net";
    $Success = $Response.StatusCode -eq 200;
    # End test
    $Availability.Success = $Success;
}
Catch
{
    # Submit Exception details to Application Insights
    $Availability.Message = $_.Exception.Message;
    $ExceptionTelemetry = [Microsoft.ApplicationInsights.DataContracts.ExceptionTelemetry]::new($_.Exception);
    $ExceptionTelemetry.Context.Operation.Id = $OperationId;
    $ExceptionTelemetry.Properties["TestName"] = $TestName;
    $ExceptionTelemetry.Properties["TestLocation"] = $TestLocation;
    $TelemetryClient.TrackException($ExceptionTelemetry);
}
Finally
{
    $Stopwatch.Stop();
    $Availability.Duration = $Stopwatch.Elapsed;
    $Availability.Timestamp = [DateTimeOffset]::UtcNow;

    # Submit Availability details to Application Insights
    $TelemetryClient.TrackAvailability($Availability);
    # call flush to ensure telemetry is sent
    $TelemetryClient.Flush();
    $ErrorActionPreference = $OriginalErrorActionPreference;
}

Pop-Location;
Let's dissect the code:
$MyInvocation.MyCommand.Path | Split-Path | Push-Location;
If you execute the script while your current working directory (CWD) is in a different location, this line will change the CWD to the folder location of the script file. This will make sure relative paths will point to the correct files.
At the end of the script, Pop-Location is used to change CWD back to the original location.
# Update the path if you install a different version of AI NuGet package
Add-Type -Path .\Dependencies\Microsoft.ApplicationInsights.2.16.0\lib\netstandard2.0\Microsoft.ApplicationInsights.dll;
The Add-Type command will load the specified DLL which is the Application Insights SDK. Make sure the path is correct in case you installed a different version or if you need to support a different target framework moniker (TFM). Depending on the version of PowerShell and .NET on your machine, you may need to pick a different TFM.
$InstrumentationKey = $Env:APPINSIGHTS_INSTRUMENTATIONKEY;
The above command fetches the Application Insights Instrumentation Key from the environment variables. This env variable will be configured later.
# If your resource is in a region like Azure Government or Azure China, change the endpoint address accordingly.
# Visit https://docs.microsoft.com/azure/azure-monitor/app/custom-endpoints#regions-that-require-endpoint-modification
$EndpointAddress = "https://dc.services.visualstudio.com/v2/track";

$Channel = [Microsoft.ApplicationInsights.Channel.InMemoryChannel]::new();
$Channel.EndpointAddress = $EndpointAddress;
$TelemetryConfiguration = [Microsoft.ApplicationInsights.Extensibility.TelemetryConfiguration]::new(
    $InstrumentationKey,
    $Channel
);
$TelemetryClient = [Microsoft.ApplicationInsights.TelemetryClient]::new($TelemetryConfiguration);
The above snippet creates and configures the telemetry client which will be used to send the telemetry to Application Insights.
$TestName = "AvailabilityTestFunction";
$TestLocation = $Env:COMPUTERNAME; # you can use any string for this
$OperationId = (New-Guid).ToString("N");
The following variables will be sent for every piece of telemetry:
- TestName: Pick any meaningful name, this will be shown in the availability dashboard
- TestLocation: The out of the box availability tests will put their Azure region in there, but you can put anything in there that's meaningful to you. In this case, the variable is set to the computer's name also referred to as the hostname. This way you could identify which server or computer ran the test.
- OperationId: Use a GUID to ensure this is a unique identifier, the output of
(New-Guid).ToString("N")looks like '4832d6822c4b4d378ffa566cc0fe28e0'.
You could use other ways to generate ID's, but I haven't tried it.
$Availability = [Microsoft.ApplicationInsights.DataContracts.AvailabilityTelemetry]::new();
$Availability.Id = $OperationId;
$Availability.Name = $TestName;
$Availability.RunLocation = $TestLocation;
$Availability.Success = $False;
This snippet creates an AvailabilityTelemetry object and configures it with the variables you just created. This is the object you need to submit to Application Insights.
$Stopwatch = [System.Diagnostics.Stopwatch]::New()
$Stopwatch.Start();
The snippet above creates a stopwatch and starts it. The stopwatch will be used to measure the time it takes to verify the availability.
$OriginalErrorActionPreference = $ErrorActionPreference;
Try
{
   $ErrorActionPreference = "Stop";
The $ErrorActionPreference is a variable always available in PowerShell and it determines the default error action preference for PowerShell commands which defaults to "Continue". When the error action preference is set to "Continue", it will output errors to the console, but just continue as if nothing happened. As a result, it won't jump to the catch clause which is undesired in this section of the script. Therefore the error action preference is changed to "Stop" which will make the script jump to the catch clause on error.
To undo the change to $ErrorActionPreference later, you need to store the original value in $OriginalErrorActionPreference.
  # Run test
  $Response = Invoke-WebRequest -Uri "https://swimburger.net";
  $Success = $Response.StatusCode -eq 200;
  # End test
  $Availability.Success = $Success;
}
Between the "Run test" and "End test" comment, you should perform whatever checks you need to verify the availability of your application. The verification in the above test is a simple HTTP request to my website and verifying whether the response status code is 200. That's essentially the same as what the built-in URL Ping test does, but you could replace this with selenium UI tests, database connection tests, etc. Whatever you can do with PowerShell you could use to verify availability.
If an error occurs, the script jumps to the following catch clause:
Catch
{
  # Submit Exception details to Application Insights
  $Availability.Message = $_.Exception.Message;
  $ExceptionTelemetry = [Microsoft.ApplicationInsights.DataContracts.ExceptionTelemetry]::new($_.Exception);
  $ExceptionTelemetry.Context.Operation.Id = $OperationId;
  $ExceptionTelemetry.Properties["TestName"] = $TestName;
  $ExceptionTelemetry.Properties["TestLocation"] = $TestLocation;
  $TelemetryClient.TrackException($ExceptionTelemetry);
}
In the catch clause, an ExceptionTelemetry object is created and initialized with the exception which just occurred. You have to use the same $OperationId for the ExceptionTelemetry so that Application Insights can relate telemetry instances with each other.
Finally, the invocation of $TelemetryClient.TrackException will queue the data submission to Application Insights.
Finally
{
  $Stopwatch.Stop();
  $Availability.Duration = $Stopwatch.Elapsed;
  $Availability.Timestamp = [DateTimeOffset]::UtcNow;

  # Submit Availability details to Application Insights
  $TelemetryClient.TrackAvailability($Availability);
  # call flush to ensure telemetry is sent
  $TelemetryClient.Flush();
  $ErrorActionPreference = $OriginalErrorActionPreference;
}

Pop-Location;
Whether there was an error or not, the script will always run the statements inside the Finally clause. The stopwatch is stopped and the duration of the test is stored in the Duration property. The current time is also pushed into the AvailabilityTelemetry via the Timestamp property. The invocation of $TelemetryClient.TrackAvailability will queue the data submission to Application Insights. The data may or may not have been transmitted to Application Insights, but calling $TelemetryClient.Flush() will ensure it is sent.
Finally, the error action preference is reversed to its original value and the CWD is reset to the original CWD.
Testing out the custom PowerShell Availability Test #
You will need the instrumentation key to send any Telemetry to Application Insights. To find this key, navigate to the Overview blade of your Application Insights resource and copy the "Instrumentation Key":

Set the key as a temporary environment variable in your shell:
$Env:APPINSIGHTS_INSTRUMENTATIONKEY = "[INSERT_KEY_HERE]"
Once you close your shell, the environment variable will not be available anymore. Refer to this documentation if you want to save the environment variables permanently.
Invoke the script like this:
.\CheckAvailability.ps1
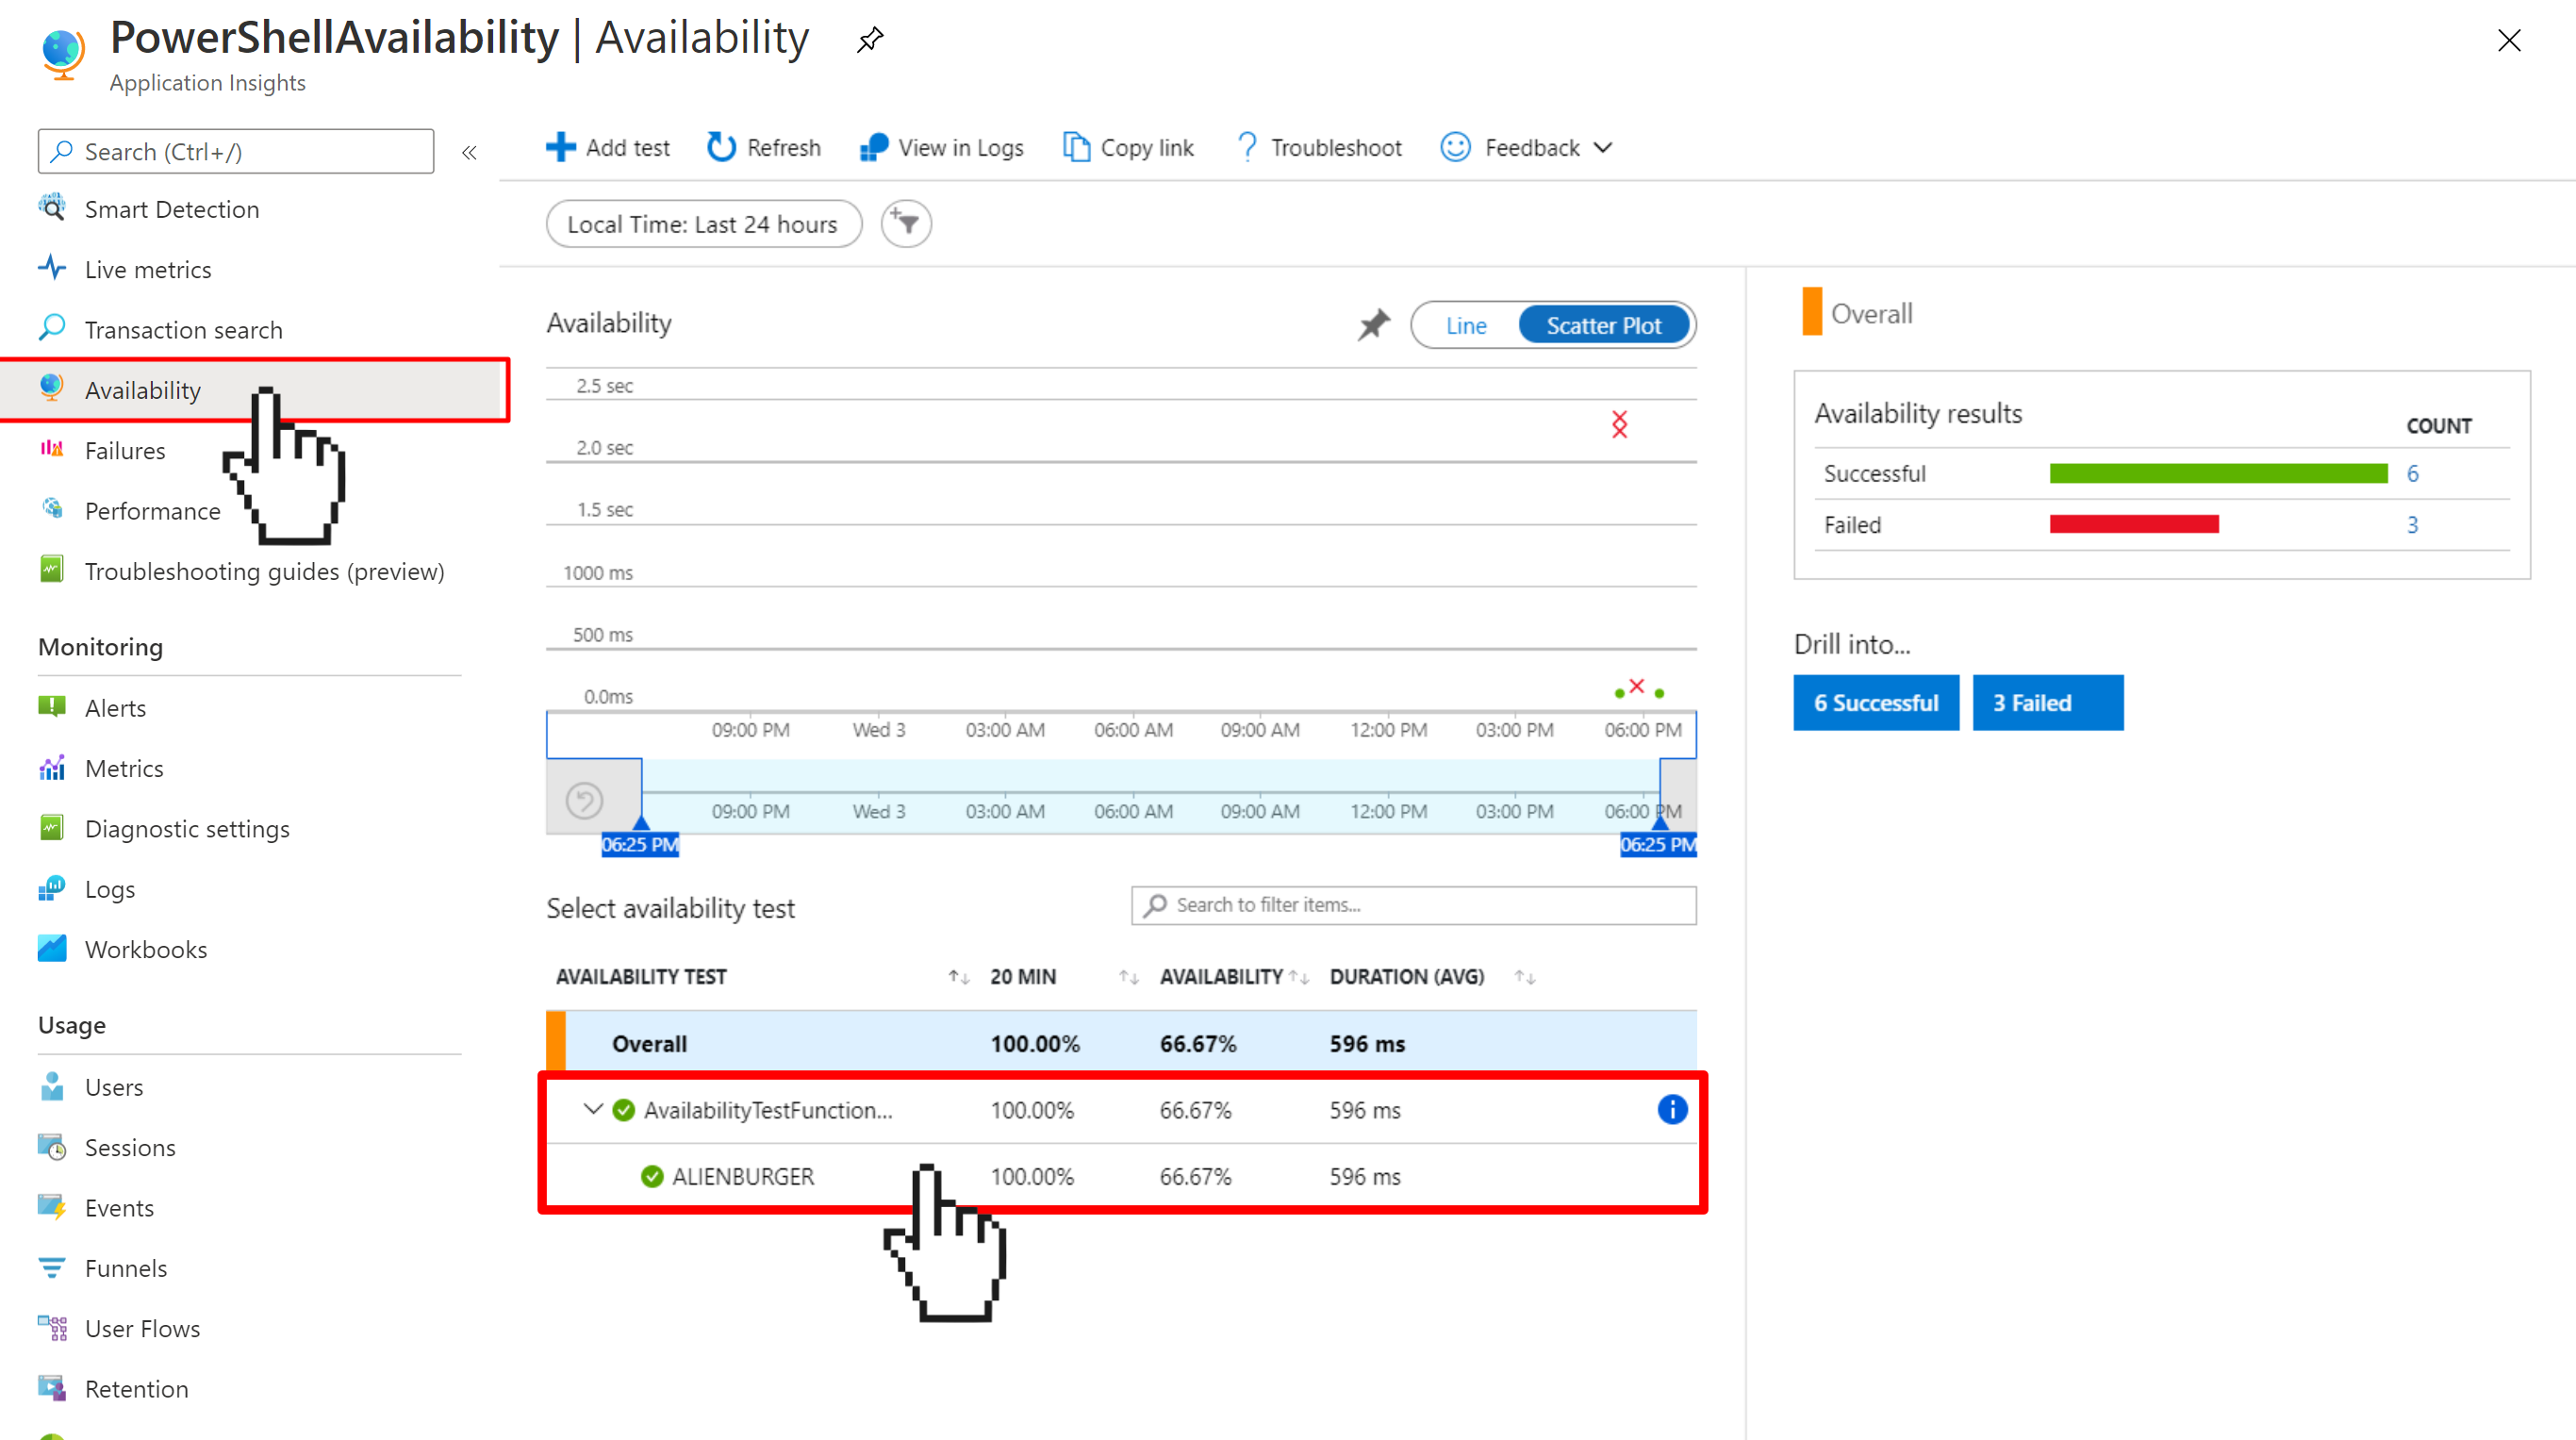
Run the script a couple of times to get multiple data points. Then navigate to the "Availability" blade of Application Insights in the Azure Portal and confirm the data is showing up:

Note: it can take a couple of minutes for the data to show up.
You probably want the availability test to run on a recurring basis. On Windows, you can configure a recurring Windows Task and on Linux, you can use the built-in crontab functionality.
Alternatively, you could turn the script into an infinite loop with a 30-second sleep in between iterations. Just make sure you're using a non thread blocking sleep or you'll be wasting unnecessary resources.
Resources #
- Learn more about Application Insights in the Microsoft Docs.
- The PowerShell script in this article is based on the following C# Azure Function provided in the Microsoft Docs.
- To learn how to UI test web applications using .NET Core, check out "How to UI test using Selenium and .NET Core on Windows, Ubuntu, and maybe MacOS?".


