---
title: "Querying 404's using Kusto and Log Analytics in Azure Application Insights"
description: "Using the built-in Log Analytics workspace in Azure Application Insights, you can query all the URL's causing 404 HTTP Status responses."
canonical: "https://swimburger.net/blog/azure/querying-404s-using-kusto-and-log-analytics-in-azure-application-insights"
published: "2020-10-30T00:00:00.000Z"
updated: "2020-10-31T00:44:48.823Z"
---

# Querying 404's using Kusto and Log Analytics in Azure Application Insights

When you integrate Azure Application Insights into your web applications, a lot of telemetry is captured and made available for querying and visualizing. HTTP requests are one of those datapoints stored in the underlying Log Analytics workspace. 

Over time websites evolve and so do their URL's. One challenge in maintaining websites is finding broken URL's that no longer exist and providing redirects to the new location of the content. Using Application Insights and its built-in Log Analytics workspace, you can easily query HTTP requests that resulted in a 404 HTTP Status response code.

## Querying 404's 

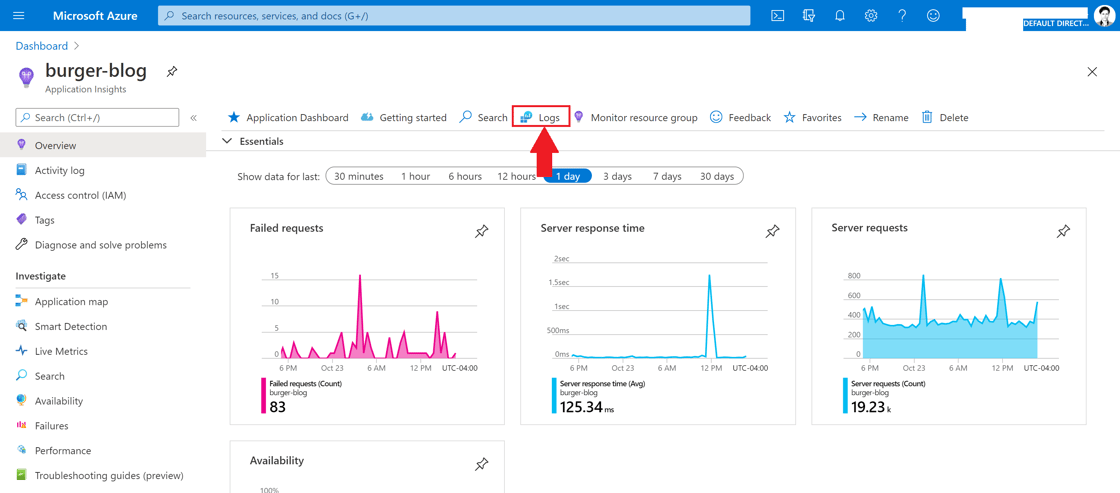
Navigate to your Application Insights resource in the Azure Portal:
<picture><img src="https://swimburger.net/cdn-cgi/image/format=auto,quality=90,width=1120/media/qn0ozjth/application-insights-resource.png" srcset="https://swimburger.net/cdn-cgi/image/format=auto,quality=90,width=430/media/qn0ozjth/application-insights-resource.png 430w, https://swimburger.net/cdn-cgi/image/format=auto,quality=90,width=645/media/qn0ozjth/application-insights-resource.png 645w, https://swimburger.net/cdn-cgi/image/format=auto,quality=90,width=718/media/qn0ozjth/application-insights-resource.png 718w, https://swimburger.net/cdn-cgi/image/format=auto,quality=90,width=860/media/qn0ozjth/application-insights-resource.png 860w, https://swimburger.net/cdn-cgi/image/format=auto,quality=90,width=1077/media/qn0ozjth/application-insights-resource.png 1077w, https://swimburger.net/cdn-cgi/image/format=auto,quality=90,width=1120/media/qn0ozjth/application-insights-resource.png 1120w, https://swimburger.net/cdn-cgi/image/format=auto,quality=90,width=1436/media/qn0ozjth/application-insights-resource.png 1436w, https://swimburger.net/cdn-cgi/image/format=auto,quality=90,width=1680/media/qn0ozjth/application-insights-resource.png 1680w, https://swimburger.net/cdn-cgi/image/format=auto,quality=90,width=2240/media/qn0ozjth/application-insights-resource.png 2240w" sizes="(max-width: 480px) 430px, (max-width: 768px) 718px, 1120px" width="1120" height="493" alt="Screenshot of an Azure Application Insights resource" loading="lazy" decoding="async"></picture>

Navigate to the 'Logs' section:

<picture><img src="https://swimburger.net/cdn-cgi/image/format=auto,quality=90,width=1120/media/gdpbboih/application-insights-404-log-query.png" srcset="https://swimburger.net/cdn-cgi/image/format=auto,quality=90,width=430/media/gdpbboih/application-insights-404-log-query.png 430w, https://swimburger.net/cdn-cgi/image/format=auto,quality=90,width=645/media/gdpbboih/application-insights-404-log-query.png 645w, https://swimburger.net/cdn-cgi/image/format=auto,quality=90,width=718/media/gdpbboih/application-insights-404-log-query.png 718w, https://swimburger.net/cdn-cgi/image/format=auto,quality=90,width=860/media/gdpbboih/application-insights-404-log-query.png 860w, https://swimburger.net/cdn-cgi/image/format=auto,quality=90,width=1077/media/gdpbboih/application-insights-404-log-query.png 1077w, https://swimburger.net/cdn-cgi/image/format=auto,quality=90,width=1120/media/gdpbboih/application-insights-404-log-query.png 1120w, https://swimburger.net/cdn-cgi/image/format=auto,quality=90,width=1436/media/gdpbboih/application-insights-404-log-query.png 1436w, https://swimburger.net/cdn-cgi/image/format=auto,quality=90,width=1680/media/gdpbboih/application-insights-404-log-query.png 1680w, https://swimburger.net/cdn-cgi/image/format=auto,quality=90,width=2240/media/gdpbboih/application-insights-404-log-query.png 2240w" sizes="(max-width: 480px) 430px, (max-width: 768px) 718px, 1120px" width="1120" height="493" alt="Screenshot of Azure Application Insights Log Analytics workspace querying 404's" loading="lazy" decoding="async"></picture>

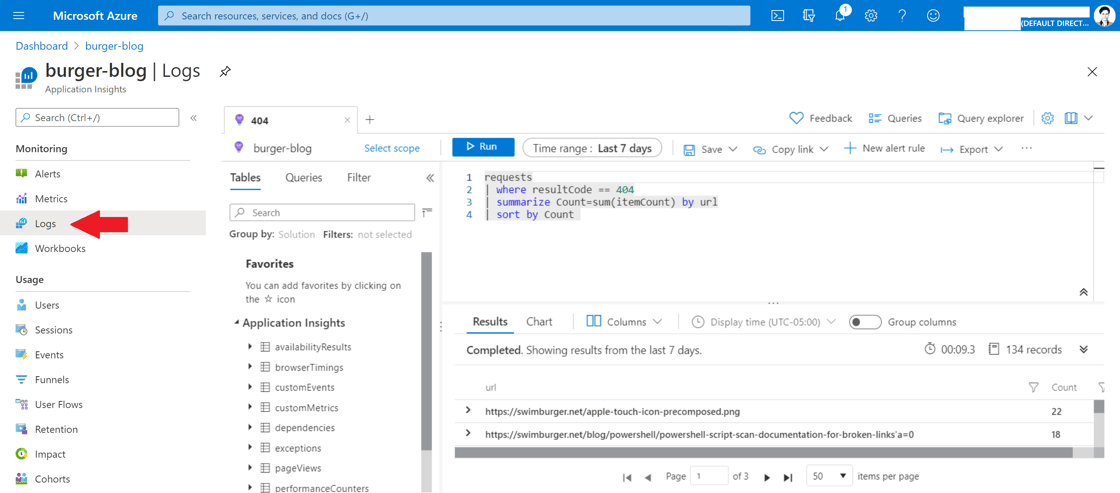
Inside of the query editor, copy/paste the following Kusto query:

```kusto
requests
| where resultCode == 404
| summarize Count=sum(itemCount) by url
| sort by Count
```

This query does the following:

-   fetch requests from the '**requests**' table. This is the table where HTTP requests are stored.
-   filter to requests that resulted in a 404 HTTP Status response.
-   Group the requests by **'url'.** Sum-aggregate the request rows by the '**itemCount**' property. 'itemCount' will be 1 or higher depending on how the requests were sampled. If similar requests were sampled, they are rolled into a single row and the 'itemCount' is increased.
-   Sort descending by the aggregated '**Count**'.

The result will be a table where every URL represents a row and you can see the amount of requests made to that URL resulting in 404. You can use this data to find your biggest 404-issues and then manually figure out how to resolve them.

404's don't have to necessarily be resolved. When a URL doesn't have any content and there's no new location where that content lives, a 404 is the correct response. Though from a business perspective, that may not be the desired user experience.

Hopefully, this helps you improve your websites!